Infographic Sizes: Canva, Social Media & Web Dimensions
Infographics3 min read
Written by Sameena SultanaPublished Updated
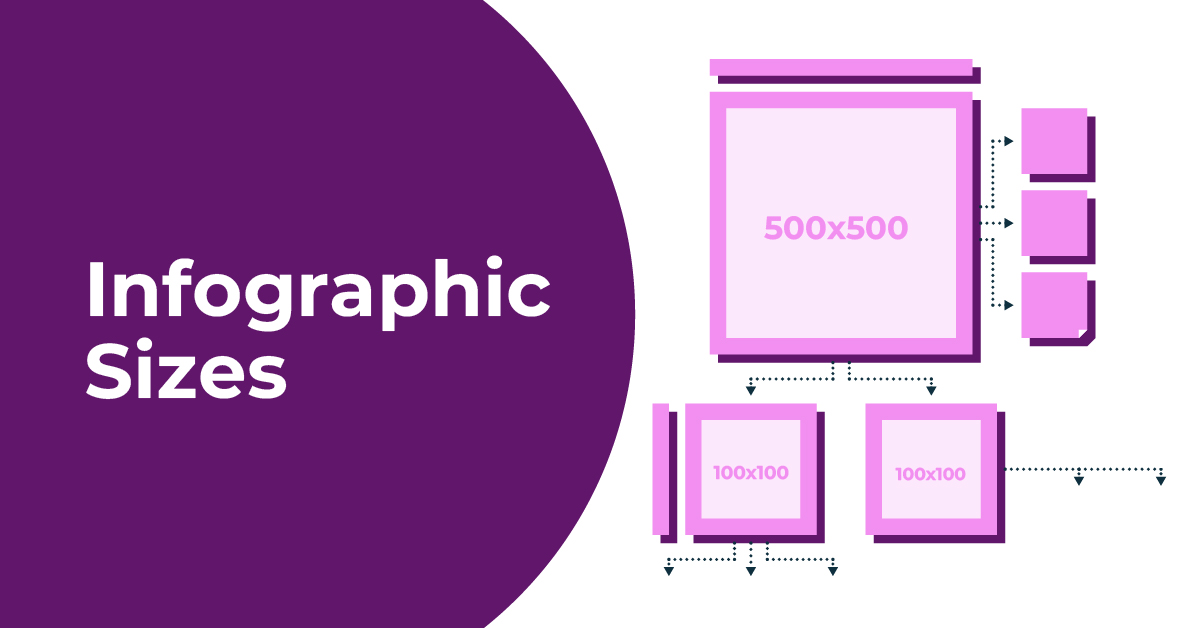
Creating the perfect infographic goes beyond compelling visuals and engaging content, it’s about choosing the right digital infographic sizes for each platform in 2026. With platforms evolving their algorithms and design standards, keeping up with the latest infographic sizes is essential to ensure your content stands out.
Whether you’re creating infographics for social media, websites, blogs, email campaigns, or presentations, this 2026 guide will help you optimize for visibility, engagement, and professional presentation.
Infographics remain one of the most powerful digital storytelling tools. But their effectiveness depends heavily on presentation and sizing. Each platform, whether it’s Instagram Reels, LinkedIn, or even TikTok has unique size requirements that directly affect clarity and engagement.
This guide will break down the latest 2026 Digital infographic size recommendations so your content looks polished, professional, and platform-ready.
TL;DR
- Standard size (2026): 800 × 2000 px, optimized for mobile-first engagement.
- Instagram: Portrait 1080 × 1350 px (ideal for feed + Reels cover).
- Pinterest: 1000 × 1500 px (2:3), or up to 1000 × 2100 px for long pins.
- LinkedIn: 1200 × 1200 px (square) or 1080 × 1350 px (portrait).
- Print: A4 (21 × 29.7 cm) or A3 (29.7 × 42 cm) at 300 DPI.
- Why it matters: Adapting infographic dimensions boosts visibility, engagement, and professional appeal across platforms.
What Size Is an Infographic in Canva?
Canva's default infographic size is 800 × 2000 px, a tall, scroll-friendly layout. You don't have to keep it: enter a custom size when you create a new design, using the platform sizes in this guide (for example, a 1080 × 1350 px infographic for an Instagram post).
How to change the infographic size in Canva
- New design: click Create a design → Custom size, enter the width and height, and pick the unit (px, in, mm or cm). This works on the free plan.
- Existing design: use Resize at the top of the editor. Resize is a paid feature. On the free plan, create a new custom-size design and copy your elements across.
- Long infographics: keep the width at 800–1000 px and increase the height. If it gets much taller than about 3× the width, consider splitting it into two or three parts so it stays readable on phones.
Why Infographic Sizes Matter in 2026
The digital content landscape keeps evolving. In 2026
- Mobile-first design dominates → most people will see your infographic on a phone, so tall, narrow layouts read best.
- Algorithm favorability → Platforms like Instagram, LinkedIn, and TikTok boost properly sized visuals.
- Cross-platform adaptability → One-size-fits-all is outdated. Each channel has unique requirements.
Your infographic’s effectiveness is directly tied to its dimensions, the wrong size risks cropping, pixelation, or poor engagement.
Standard Infographic Sizes
An infographic is a visual tool that combines charts, diagrams, icons, and images to present data or information in a clear, engaging way making complex topics easy to grasp at a glance.
Infographics are powerful tools for conveying information in a visually appealing and digestible manner. To ensure your infographics are displayed optimally across various platforms, it's crucial to be mindful of the size requirements.
There's no official standard size for an infographic. The most common size is 800 × 2000 px (width × height), which is also Canva's default. Older guides often quote 600 × 1200 px; that still works for simple, short infographics.
Can an infographic be landscape?
Yes. Use a landscape layout when the infographic will sit in a slide, a website banner or a video:
- Presentations and video: 1920 × 1080 px (16:9)
- X and LinkedIn link-style images: 1200 × 675 px
- Wide blog layouts: 1200 × 800 px
Portrait is still the better choice for anything people will scroll through on a phone.
Infographic Sizes for Print (Inches, cm and Pixels)
For print, design at 300 DPI. These are the common paper sizes and the pixel size you need at 300 DPI:
Paper size | Centimetres | Inches | Pixels at 300 DPI |
|---|---|---|---|
A4 | 21 × 29.7 cm | 8.3 × 11.7 in | 2480 × 3508 px |
A3 | 29.7 × 42 cm | 11.7 × 16.5 in | 3508 × 4961 px |
A2 | 42 × 59.4 cm | 16.5 × 23.4 in | 4961 × 7016 px |
US Letter | 21.6 × 27.9 cm | 8.5 × 11 in | 2550 × 3300 px |
Tabloid | 27.9 × 43.2 cm | 11 × 17 in | 3300 × 5100 px |
In Canva, choose cm or inches in the Custom size box, and download as PDF Print for the sharpest result.
Digital Infographic Sizes for Different Platforms
Digital Infographic Sizes for Blog Posts
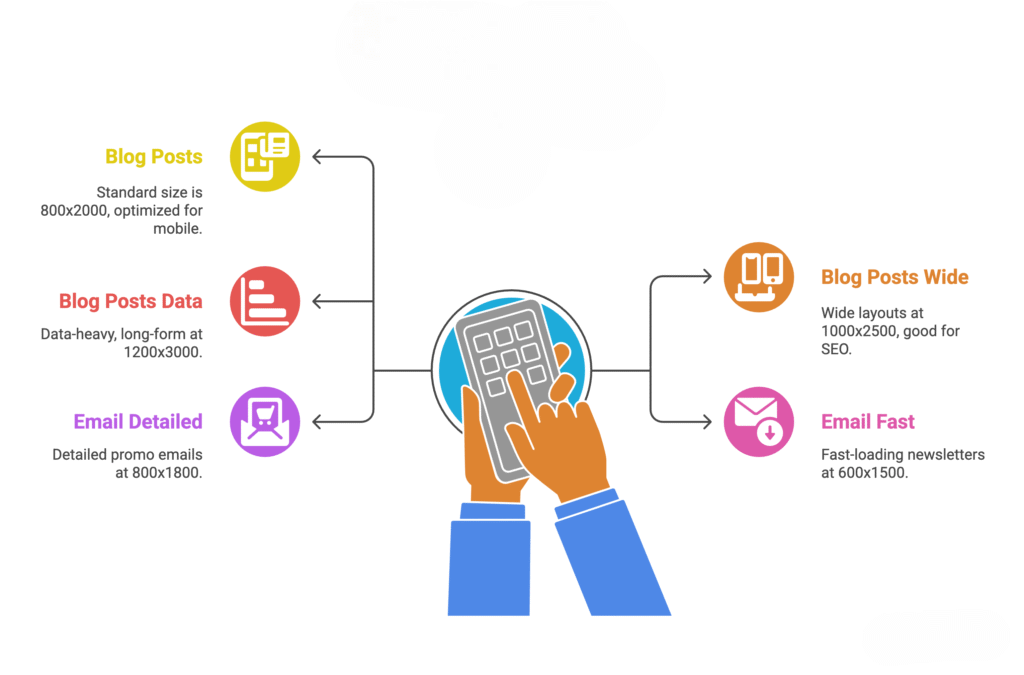
- 800 px Wide × 2000 px Tall → This is Standard, mobile-optimized size for most blog layouts.
- 1000 px Wide × 2500 px Tall → Great for blogs with wide layouts and SEO-rich long infographics.
- 1200 px Wide × 3000 px Tall → Perfect for data-heavy, detailed infographics designed to maximize time-on-page.
Increased sizes for blogs due to Google’s preference for mobile-first indexing and long-form visual content in 2026.
Email-Friendly Infographic Sizes
- 600 px Wide × 1500 px Tall → Best for quick-loading visuals in newsletters.
- 800 px Wide × 1800 px Tall → Works well for promotional emails with detailed visuals.
Confused by all these sizing rules? Don’t worry.
Design Shifu has you covered in 2026. A dedicated design team sizes your infographics for every platform you need. Get an unlimited request queue and unlimited revisions, starting at $549/month with a 14-day money-back guarantee.
Upgrade your visuals in 2026. Subscribe today!
Digital Infographic Sizes for Social Media
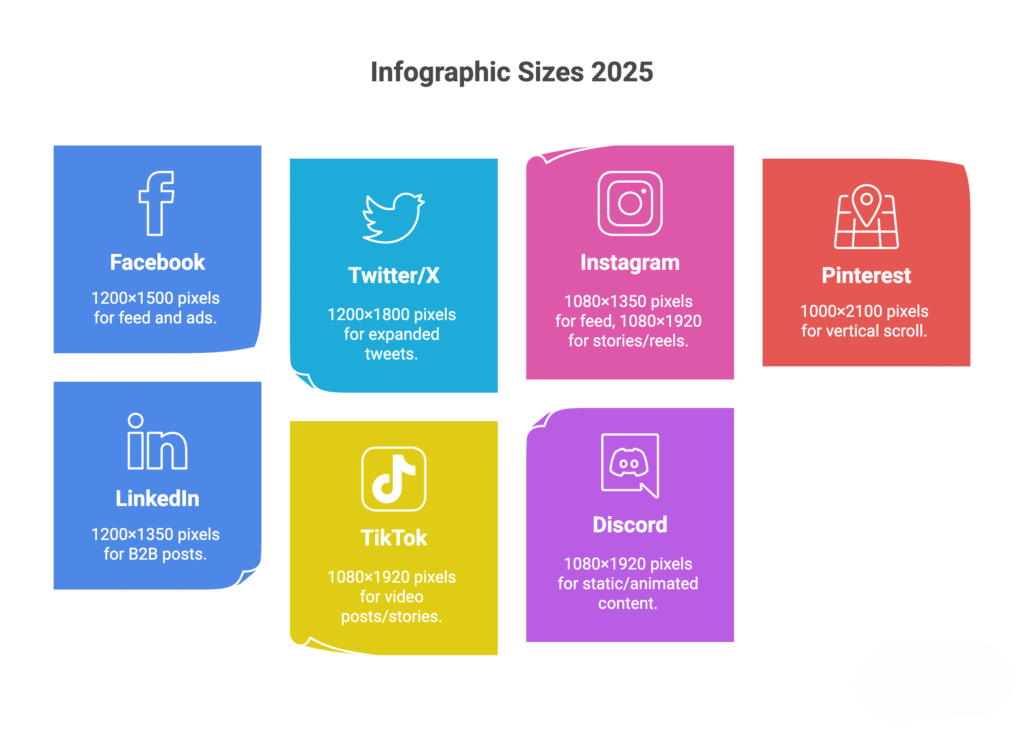
Digital Infographic sizes for Facebook
- 1200 px Wide × 1500 px Tall → Recommended for newsfeed and ads.
Twitter / X
- 1200 px Wide × 1800 px Tall → Best for engagement in expanded tweets.
- 1080 px Wide × 1350 px Tall (portrait posts) → Most effective for feed.
- 1080 px Wide × 1920 px Tall (stories & reels) → Optimized for full-screen mobile engagement.
- 1000 px Wide × 1500 px Tall (2:3) → Recommended pin size.
- 1000 px Wide × 2100 px Tall → The longest pin before Pinterest crops it in the feed.
- 1200 px Wide × 1200 px Tall (square) or 1080 px Wide × 1350 px Tall (portrait) → Work best for B2B visual storytelling.
Digital Infographic sizes TikTok (NEW in 2026)
- 1080 px Wide × 1920 px Tall → Infographics optimized for TikTok video posts and stories.
Discord
- 1080 px Wide × 1920 px Tall → Still the standard, but animations now perform better.
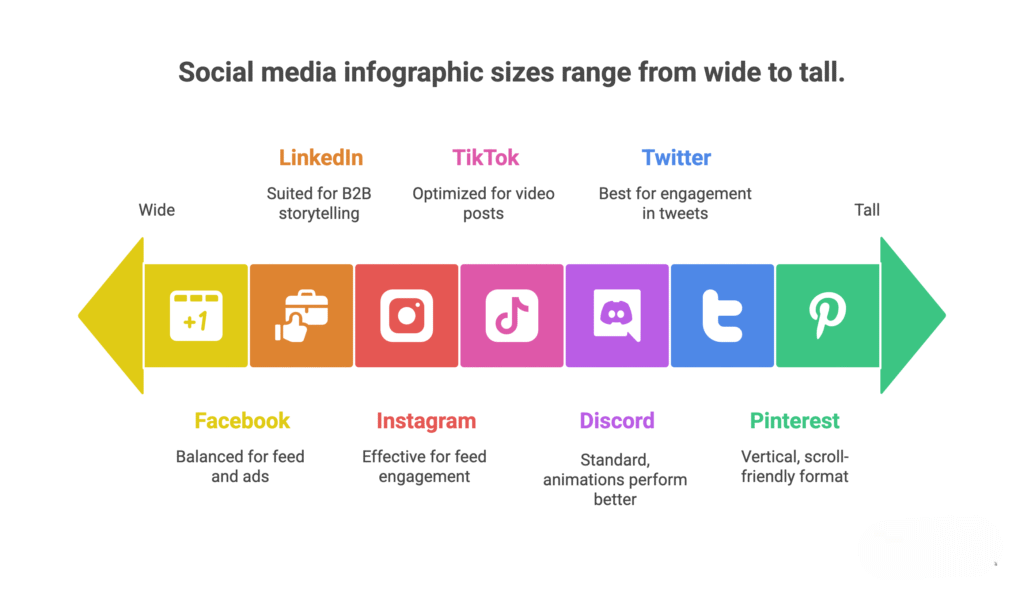
Key Takeaways
- Standard 2026 infographic size: 800 x 2000 px (scroll-friendly + mobile optimized).
- Social-first updates:Twitter/X → 1600 x 900 px
- Instagram portrait → 1080 x 1350 px
- Pinterest → 1000 x 1500 px
- LinkedIn → 1200 x 1200 px
Formats: PNG (quality), JPG (lightweight), SVG (scalable, trending in 2026).Tools: Canva, Figma, and Adobe with AI resizing = faster multi-platform adaptation. You can also explore Venngage’s infographic templates, which offer ready-to-edit layouts in correct digital infographic sizes.Mobile-first is key → Longer, scroll-friendly infographics drive higher engagement.
Conclusion
Infographics are still among the best tools for storytelling visually in 2026. But it's all dependent on getting the right size for the platform. Since people are watching more on mobile, scroll-friendly and platform-optimized sizes are a must-have.
By following these updated sizing rules and leveraging modern design tools with AI-powered resizing, you’ll ensure your infographics look professional, boost engagement, and stand out across social media, blogs, email, and presentations.
Pro tip: Design once at 800 x 2000 px, then use AI resizing tools to quickly repurpose for each platform.
Frequently asked questions
What is the standard size of an infographic in 2026?
The recommended standard is 800×2000 px , designed for mobile-first audiences.
What size should an infographic be printed?
Infographic sizes for print can vary based on the intended use. However, a common recommendation is to design print infographics at a higher resolution, should be created at 300 DPI , ideally in A3 (11.7 × 16.5 in) or A2 (16.5 × 23.4 in) depending on complexity.
What size is an infographic on Canva?
Canva provides flexibility in choosing your infographic dimensions. While there isn't a fixed size, Canva now defaults to 800×2000 px , but sizes can be easily customized within Canva's platform.
What is the best format for infographics in 2026?
For web → PNG/WebP (lighter & SEO-friendly). For print → PDF/X-4 or TIFF with CMYK profile.
What are the best tools to create animated/video infographics in 2026?
Adobe After Effects (AI-driven templates) Vyond (improved 2026 version) Canva Pro with AI Animation tools Genmo / Runway (AI-generated motion infographics)
What are some of the best websites to find infographics?
Pinterest (still #1 for infographics) Dribbble & Behance (designer showcases) Designspiration (2026 update: AI-powered search)
How long does it take to turn around an infographic?
With AI-assisted design tools like Canva AI and Figma Plugins, simple infographics can take 15–30 minutes , while complex data visuals may still require 2–3 hours .
About the author